This section examines the future we are heading towards based on an assessment of medium- and long-term trends and risks.
Insights in this section point to growing demand for human services, unsustainable projected government expenditure and complexity impacting service access and delivery.
Insight 1: Community demand and expectations are growing
Community demand for human services is expected to increase due to an ageing population, an increase in chronic illness and a reduction in informal care, as care givers return to the workforce. The expectation that services will be high quality, equitable and easily accessible is also growing in Australia.
Australia’s ageing population is driving demand for care and support services
One of the most significant trends shaping Australia’s future is an ageing population, driven by increasing life expectancies and declining fertility rates.40 As a population, Australia is ageing at a rapid rate, a trend kick-started in the early 2010s when the baby boomer generation started to reach the age of 65 (see Figure 5).41 The number of Australians aged over 65 years is projected to grow to by 6.1% over the next 40 years, with almost half of that growth projected to be among those Australians aged over 85 years. Older Australians are expected to represent 23.4% of Australia’s population by 2063.42 Australia’s ageing population is a driver of increasing demand for human services, including aged care and health services.
Figure 5. The proportional age structure of Australia’s population43
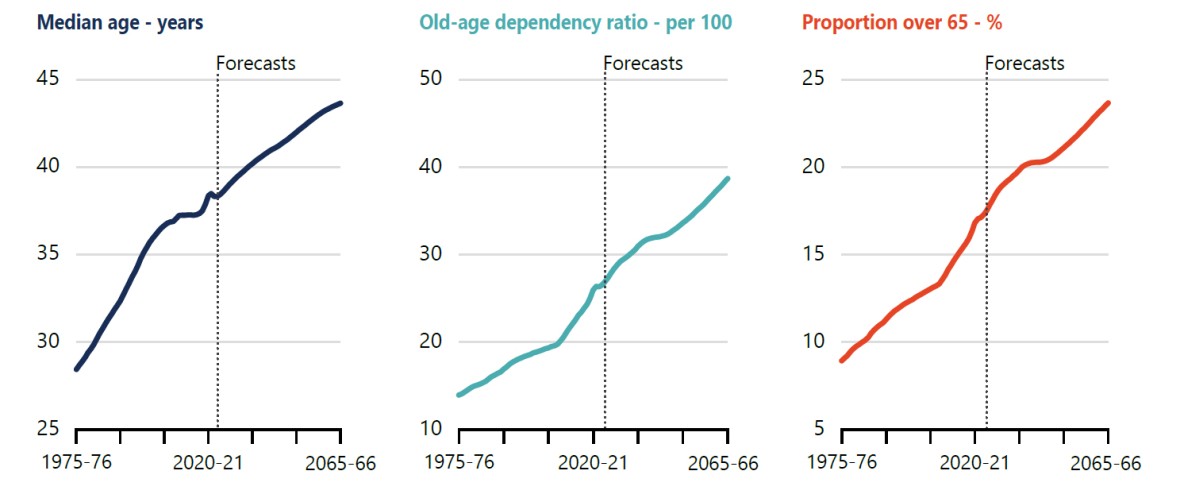
The needs of an ageing population vary across Australian communities and the human services requirements are diverse.
The age structure for Aboriginal and Torres Strait Islander people is younger than that of non-Indigenous Australians, due to higher fertility rates and lower life expectancy.44 While the population of Aboriginal and Torres Strait Islander people is also gradually ageing, it is at a slower rate than non-Indigenous Australians.45 Over 15 years, between 2016 to 2031, the proportion of Aboriginal and Torres Strait Islander people over the age of 50 is projected to increase from 16 to 20%.46 The needs and experiences of older Aboriginal and Torres Strait Islander people are unique, with cultural connection an important aspect of wellbeing and Elders’ significant role in community (providing cultural wisdom and support).47 It is important for many older Aboriginal and Torres Strait Islander people to be able to receive support in-place, in community, and from a culturally competent provider.
As Australians live longer, the number of years that Australians live in ill-health is expected to rise.48 Older Australians, in particular, are likely to experience multiple, overlapping health conditions as their life expectancy increases. In 2022, approximately 94% of Australians over the age of 85 lived with a chronic condition, contributing to growing demands for human services.49 As age is a common and unavoidable risk factor for many chronic conditions, there will be increasing pressures for the treatment and management of ill-health in Australia in the long-term.50
The Australian government estimates that approximately 40% of the projected increase in government expenditure over the next 40 years will be attributable to demographic ageing.51
Increase in chronic illness is also driving demand for human services
Advances in medicine have dramatically decreased mortality rates from infectious diseases, meaning that chronic conditions are now the leading cause of ill-health.52 In 2022, 61 % of Australians were living with at least one chronic condition and 38% of Australians were living with 2 or more chronic conditions.53
Chronic conditions are generally characterised by their long-lasting and persistent effects. Once present, symptoms often persist through a person’s life and require long-term management, including support from healthcare and other professionals.54
Mental illness is increasing, particularly among younger Australians. As the onset of most mental disorders begins during the transition to adulthood, the impact of mental illness across Australians’ lives can be profound.55
Dementia and chronic liver disease are among the other fastest growing chronic conditions.56 Should the prevalence of many chronic conditions continues to rise, Australians will require more services to support the treatment and management of their conditions.57
It is estimated that 38% of the total burden of disease in Australia is preventable by reducing exposure to various behavioural, metabolic, dietary and environmental risk factors.58 Preventative measures which strengthen health determinants are the most effective way to reduce the risk of Australians developing chronic conditions.59 Strengthening determinants of health likewise support those already managing
chronic conditions by easing symptoms and work to improve the lives of Australians.60
The return to work of informal care givers is increasing the demand for formal care
In the decade between 2012 and 2022, the care workforce grew by 65%, compared to a 53% growth in the overall Australian workforce.61 This trend is projected to continue, with the care and support workforce expected to double by 2050.62
The growth in the care sector is, in part, a result of the transition from informal to formal care, particularly as women’s participation in the workforce has increased.63 This shift has resulted in greater demand for government human services, such as childcare, paid parental leave, aged care, disability and carers support.64
During consultation, Australian community members reported feeling time poor and overwhelmed with the pressures of managing multiple responsibilities. Some adults reported caring for ageing parents at the same time as caring for young children. The lack of synchronicity between school times and work times was mentioned by some survey respondents and workshop participants as a stressor for families with young children, with families struggling to find meaningful family time around other obligations.
“I have been a young carer for my disabled sister and one day I will be her primary carer. It has been challenging to navigate this while getting education and a job.”
Expectations for personalised, integrated and accessible services are growing
Australians’ expectations for high quality human services are growing.65 The quality of human services is very closely related to concepts of equity and access.66 Community service providers noted the growing community expectations around ‘universal minimal government service guarantees’ – the minimum standards for the amount, quality, and accessibility of services provided by government. Government providers noted the increase in requests for highly individualised services as opposed to services provided in small and medium group settings. For example, in seeking NDIS and family services, people were increasingly asking for a 1:1 service resulting in wait lists and others missing out.
During the consultation, we asked Australians about the extent to which they want services to be universal or personalised to meet the specific needs of different people. Most respondents (59%) expressed satisfaction with the breadth of current human service offerings. People experiencing marginalisation and disadvantage expressed higher rates of dissatisfaction with the accessibility and availability of human services and were seeking more integrated and personalised human services.67
Currently, over half (58%) of Australians trust public services and the majority (68%) of Australians are satisfied with the public services they accessed in 2024.68 Life satisfaction, age, location, gender and major life events, experiences of hardship, vulnerability, marginalisation and inequality are all negatively associated with trust, based on multiple years of surveying.69
Community service providers identified ‘market failure’ in regional and remote Australia due to limited providers, a lack of scale, the high cost of service delivery and access challenges associated with long distances. Insufficient or ‘thin’ markets do not exist solely in rural and remote contexts; they also result from a shortage of providers who can meet specific cultural or material needs of communities, including for First Nations people, homeless, LGBTQIA+, or culturally and linguistically diverse Australians.70
Service providers also raised the challenge of unmet demand when services are capped. The demand for services, particularly in aged care, can exceed the funding or places available resulting in long waiting lists and forced rationing.
Back to topInsight 2: Expenditure on human services is projected to grow
Human services expenditure, in particular for health, aged care and NDIS, is forecast to be the major spending pressure for the Australian Government over the medium and long term.71
Government spending on human services will need to be targeted and effective in delivering outcomes to Australians who need it most to ensure the long-term sustainability of the Australian Government’s budget.72
Long-term projections show human services as the major budget pressures
The Intergenerational Report identifies health, aged care and the NDIS as the top three long-term spending pressures for the Australian Government (see Figure 6).73 NDIS payments are expected to grow fastest over the next decade, while health and aged care are expected to grow most quickly towards the end of the 40 year projection period, as the population ages.74 In contrast, spending on the Australian Government age and services pension is projected to decrease from 2.3% of GDP in 2022-23 to 2% of GDP in 2062-63, in contrast to most OECD nations.75 The decrease reflects the shift towards superannuation being the main source of retirement income and means testing of the age pension to support those most in need.
Figure 6. The top five spending pressures and projected increase as per cent of GDP to 2062-6376
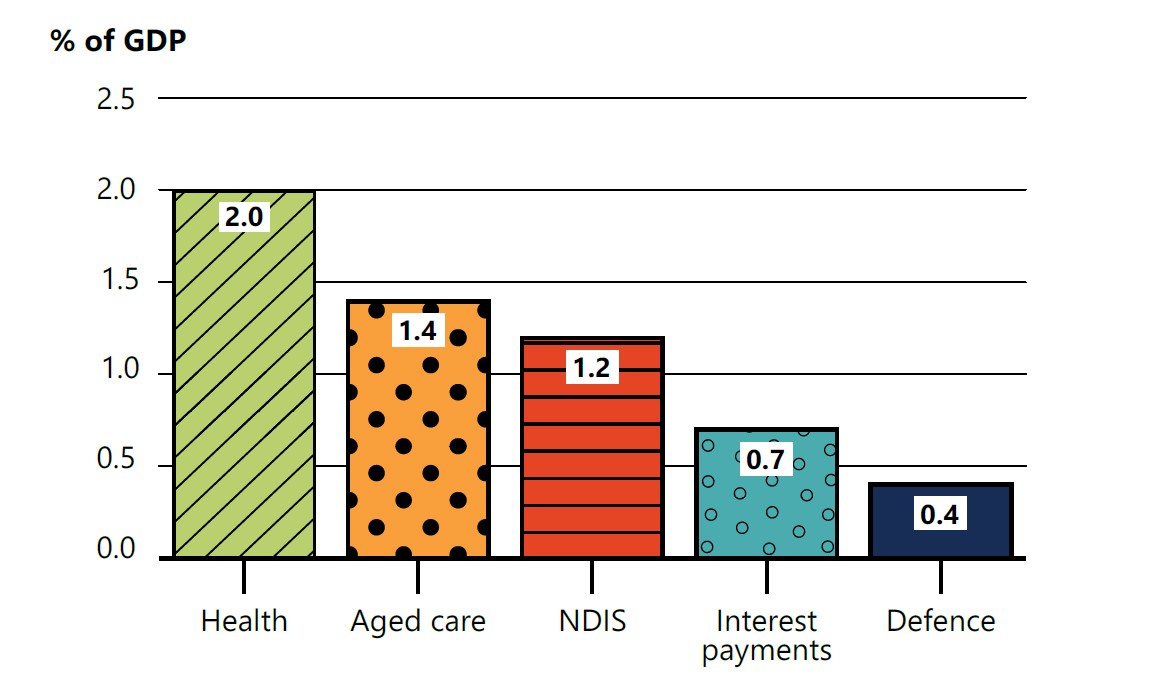
Government expenditure on human services workforces has risen in recent years to address historical under-provision or under-valuation of these services. For example, the Australian Government is investing in wage increases for aged-care nurses and childcare workers. The increasing demand for welfare workers is also expected to continue in aged care, disability, early childhood education and care services.77
Outsourcing of human service delivery is not delivering the efficiencies anticipated
The Australian Government outsources the provision of some human services by contracting private sector and not-for-profit providers. The trend to outsource human service delivery and introduce market discipline aimed to increase efficiency, bring in competition and empower service users to choose between providers to best meet their needs.78 The Productivity Commission found that not-for-profit organisations were the major providers in most human service areas across Australian governments and that there were around 20,000 non-profit organisations in the human services sector that relied on government for their main source of funding.79
Evaluations of the market-based model show that it can work well for Australians who have straightforward and quantifiable needs. However, as shown in Table 2, Australians with more complex or nuanced needs can see poorer outcomes.80 During consultation, many experts raised concerns that the market-based model for delivery of human services was not achieving the efficiencies anticipated. The lack of market incentives for contracted providers to work on the most complex cases was also raised during consultation.
Table 2: Efficiency savings through outsourcing by type of human services
| Human service type | Potential for efficiency savings through outsourcing | Risks and success factors |
|---|---|---|
| Routine, measurable outputs | High | Success relies on competitive contracts and strong contract management. |
| Complex, relational services | Mixed/Low | Risk of reduced service quality as well as high administration and monitoring costs. |
| Thin markets | Low | Market failures with risk of a monopoly provider, elevated charging and poor quality services. |
Insight 3: Complexity is impacting access to services
Access to human services is being impacted by complexity in the system and fragmentation in service delivery. Additional barriers such as stigma, shame and physical distance are also impacting access to services.
For Australians with complex needs, First Nations people, victim-survivors, young people (aged 18 to 24), migrants and communities in regional and remote Australia the challenges of access to services are often compounded.
“I believe complexity in your delivery systems precludes certain groups from obtaining support in a reasonable time frame.”
Complexity in the system is a barrier to accessing human services
System complexity is often the result of outsourcing, competition, fragmentation and unnecessary process in the provision of human services.81
“I find accessing government support services to be complex to the point where it is a significant barrier.”
During the consultation, Australian community leaders and community organisations consistently raised concerns about complexity in the system. A third (32%) of young people (aged 18 to 24) surveyed highlighted difficulties in navigating government human services, describing the systems as overly complex and inaccessible. Australians who experience multiple, overlapping and complex issues report the human services system is increasingly challenging to navigate.82
“You almost need a PhD to navigate government services. We need to simplify service delivery models while ensuring help goes where it is needed most.”
The most recent annual trust in Australian public services report found that one in five people who accessed government services reported dissatisfaction, with the top concerns being complex system processes and challenges with access to services.83
“We are overwhelmed with forms already, why give us so many more just to get basic services? Not everybody has the time to navigate complex systems of bureaucracy. You must factor in that many people are terrified of everything right now. Gen Z is a generation of complex dread. We do not have the motivation to support ourselves.”
To address the complexity, there has been increased investment in professional system navigators to support those trying to access human services. For example, the Aged Care System Navigator and the Australian Cancer Nursing and Navigation program are 2 large-scale system navigators (see case studies below for further details).
Case study: Aged Care System Navigator
Following the Aged Care Royal Commission, the Australian Government allocated $5.1m to fund the Aged Care System Navigator Measure in the 2018-19 Budget and a further $7m through the 2021-22 Budget to extend the trial.84 This service supported people to understand which human services were available to meet their needs, connect with My Aged Care and access human services.85 Navigation support was focused on supporting Australians facing barriers in accessing aged care due to isolation, marginalisation from the system and/or specific vulnerabilities.86 The review of the trial found that navigator services were providing needed and appreciated support for older Australians and their families who were struggling to navigate the system.
Case study: Australian Cancer Nursing and Navigation program
The Australian Government has committed $406m to form a new Australian Cancer Nursing and Navigation Program in January 2025.87 The Cancer Navigation Service seeks to connect people to multidisciplinary specialist support service teams and refer people to clinically appropriate information.88
Siloed service provision is exacerbating fragmentation across the system
During the consultation, Australians highlighted the disconnect between services, the lack of a singular entry point, and the circularity of systems as common barriers encountered in seeking to access government services. The separate organisational lenses also create a siloed view of needs, which does not always account for people’s holistic circumstances and results in service providers appearing insensitive to people’s lived realities.
“Government services must get better at meeting the whole needs of the whole person that uses them. Making people navigate multiple services as individual areas is no longer acceptable – the service system should work as a cohesive whole. One service should be able to connect a person with another service they need, not just send them away to research it themselves.”
Government silos were frequently referenced as preventing the provision of comprehensive care that addressed the multidimensional needs of Australians. Silos were identified between government departments as well as between levels of government. The burden of having to engage with multiple departments, led to people experiencing navigation fatigue or simply ‘falling through the cracks’. Community members reported meeting numerous ‘dead ends’, not knowing where to go to next, or becoming frustrated by constantly needing to re-explain oneself and one’s circumstances.
“The process is complicated, and the system is set up so that people give up before they get help.”
“We get told ‘that’s an interesting issue, but it’s outside my domain so you need to talk to someone else’.”
Legislative barriers also prevent data sharing, for example between Centrelink and Medicare, and prevent a ‘tell us once’ approach. This means service users have to repeat information and details of their situation to multiple human service providers.
“Agency approaches are more about convenience to the APS [... such as] efficiency and administrative ease, and there is a tendency to only consider the bits of a person related to the portfolio.”
Siloing was described as existing within agencies as well as between agencies, with hierarchies compounding fragmentation and complicating access. Regional operational staff reported feeling disempowered to make decisions or innovate and not supported to share decision-making with the community.
“[This reflects a] 20th century organisational […] model of command and control that [… doesn’t suit] the adaptive problems that we face today.”
Beyond the silos, there is also complexity created by the inconsistency in the fundamentals for each service. Some services are means-tested (targeted to those with the highest need) and some are universal (provided to all). Experience from one service area can lead to expectations of another service.
Other barriers such as stigma, shame and distance are blocking access to services
Common barriers to access that were raised during community consultation include stigmatisation and shame, fears for safety, caring responsibilities, lack of transport options and unsuitable opening hours. Victim-survivors of family and domestic violence reported encountering additional structural barriers such as child support decisions, challenges to attending court dates and seeking legal advice/representation.
These challenges are also contextually defined, taking on different forms when encountered by migrants and refugees, those who face language barriers, those with low levels of literacy, Aboriginal and Torres Strait Islander peoples, people with disability, partners of veterans or law enforcement officers, LGBTQIA+ people, or people living in regional and remote areas.
“It is so hard to navigate the system and speak with a real person that you need someone to assist you. Not everyone has access to technology or understands what is required to get help.”
Aboriginal and Torres Strait Islander peoples often experience significant barriers to accessing healthcare. In 2018-19, 30% of Aboriginal and Torres Strait Islander people (243,700 people) reported that they needed to but did not see a health care provider on at least one occasion in the previous 12 months. Those who did not see a healthcare professional reported that competing priorities, cost and service availability were the main barriers impacting access (36%, 34% and 33% of respondents, respectively). In addition, 23% of respondents reported a dislike of available services, including because of fear and embarrassment, creating barriers to access.89
Around 7 million people (or 28% of Australians) live in rural and remote areas, where access to services is limited by distance, lack of public transport and limited availability of service options.90 Some common barriers experienced by rural and remote communities shared through this consultation were around cost, workforce challenges, lack of infrastructure and lower levels of trust in government. Migration from cities into regions is likely to continue over the next decade due to factors such as the high cost of living in major cities and growing demand for clean energy workforce.91
“Services are very mono-culturally designed and based on a metropolitan view of the country, technology and people’s abilities to access services (we all do not have access to Uber Eats, reliable internet, 24 hour medical services or public transport).”
While many Australians experience disadvantage at some point in their lives, for most, it is temporary. Entrenched disadvantage, however, affects a small but significant proportion of the Australian population. Entrenched disadvantage is multidimensional: a combination of poverty, deprivation and social exclusion. There are around 700,000 Australians currently experiencing persistent and recurrent poverty, indicative of entrenched disadvantage.92 Whilst Australia has relatively high income mobility, people at either end of the income distribution are more likely to remain there, contributing to enduring entrenched disadvantage and divides. Entrenched disadvantage can be a self-reinforcing cycle that passes from one generation to the next, with studies showing that children raised in welfare-dependent families are significantly more likely to rely on social security in adulthood.93 No single human service is likely to offer adequate support for those experiencing entrenched disadvantage. Place-based partnerships can be an effective method to identify and address areas of entrenched disadvantage in Australia’s communities; see case study below on The entrenched disadvantage package.
Case study: The entrenched disadvantage package94
The Australian Government, in the 2023–24 Budget, allocated $199.8 million to a package of measures targeting entrenched community disadvantage. The measures aim to address intergenerational disadvantage and improve child and family wellbeing. The package includes a whole of government framework to address community disadvantage, improved data on which to base decisions (Life Course Data Initiative) and an Outcomes Fund to see social enterprises tackle disadvantage.
The package also includes $64 million for place-based partnerships, to extend the Stronger Places, Stronger People initiative to enable community-led change in partnership with 10 communities and state and territory governments, and to enhance shared decision-making and local solutions in 6 of these communities. Place-based partnerships will see the development of co-designed solutions that address community needs and aspirations, including support for local initiatives that drive better outcomes in education and employment, child and maternal health, youth justice, and participation.