Overall government results
At 30 June 2021, there were 342 Australian Government boards with 2,315 filled positions. Women filled 49.6 per cent of all board positions (1,149 positions were filled by women).
This result is an increase of 1.1 percentage points since 30 June 2020 when women filled 48.5 per cent of Government board positions (1,206 of 2,489 filled positions).
Table 1 details the number of boards, number and percentage of occupied positions by gender, and the percentage point difference from the previous year, since 2016.
| Year | Number of boards | Number of filled positions | Number of women | Number of men | Percentage of positions filled by women | Percentage point change since previous year |
|---|---|---|---|---|---|---|
| 2021 | 342 | 2,315 | 1,149 | 1,166 | 49.6 | +1.1 |
| 2020 | 343 | 2,489 | 1,206 | 1,283 | 48.5 | +0.6 |
| 2019 | 341 | 2,313 | 1,109 | 1,204 | 47.9 | +2.1 |
| 2018 | 339 | 2,530 | 1,158 | 1,372 | 45.8 | +3.1 |
| 2017 | 337 | 2,508 | 1,072 | 1,436 | 42.7 | +2.2 |
| 2016 | 332 | 2,351 | 953 | 1,395 | 40.5 | +1.4 |
Portfolio results
At 30 June 2021, seven out of 13 portfolios met or exceeded the 50 per cent gender diversity target: Social Services (including Services Australia); Health; Industry, Science, Energy and Resources; Education, Skills and Employment; Prime Minister and Cabinet; Foreign Affairs and Trade; and Attorney-General’s.
Women held between 45 and 50 per cent of board positions in a further three portfolios: Defence (including the Department of Veterans’ Affairs); Agriculture, Water and the Environment; and Treasury (see Figure 1 and Table 2).
Figure 1: Gender balance of overall Australian Government board positions as at 30 June 2021, by portfolio
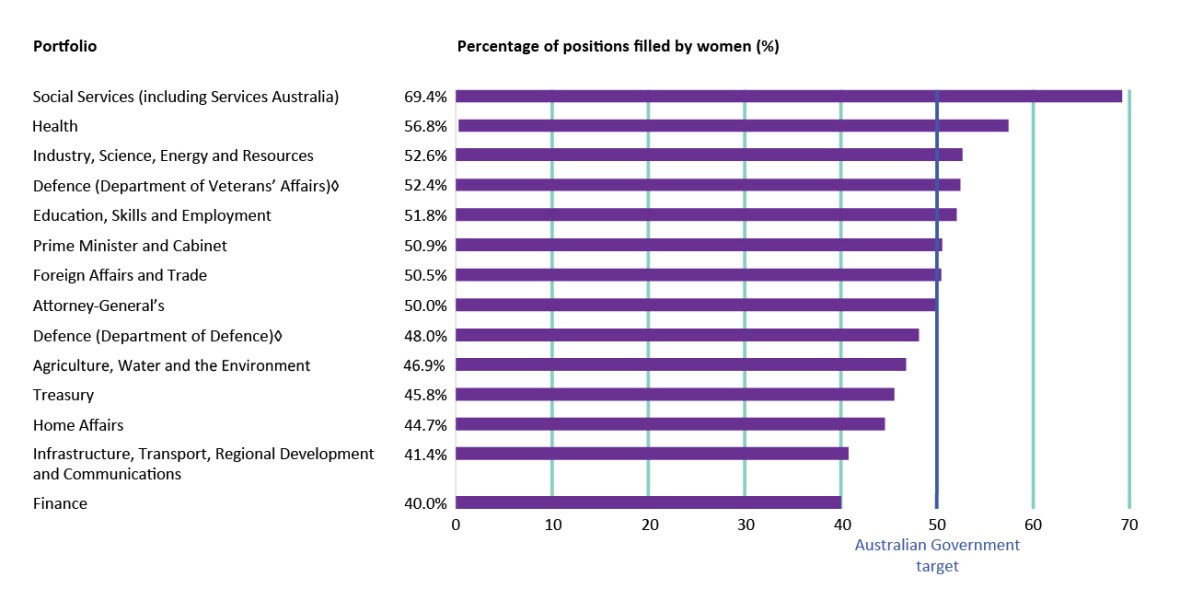
◊ Split shown given the two-department structure within the Defence portfolio. Women held 49.3 per cent of positions in the Defence portfolio on 30 June 2021
| Portfolio | Number of boards | Number of filled positions | Number of women | % of positions filled by women at 30 June 2021 | % of positions filled by women at 30 June 2020 | Percentage point difference from 30 June 2020 to 30 June 2021 |
|---|---|---|---|---|---|---|
| Agriculture, Water and the Environment | 34 | 241 | 113 | 46.9 | 48.5 | −1.6 |
| Attorney-General's | 14 | 98 | 49 | 50.0 | 46.2 | 3.8 |
| Defence (Department of Defence)◊ | 15 | 102 | 49 | 48.0 | 45.9 | 2.1 |
| Defence (Department of Veterans’ Affairs)◊ | 6 | 42 | 22 | 52.4 | 54.9 | −2.5 |
| Education, Skills and Employment | 18 | 110 | 57 | 51.8 | 47.2 | 4.6 |
| Finance | 6 | 35 | 14 | 40.0 | 41.0 | −1.0 |
| Foreign Affairs and Trade | 24 | 184 | 93 | 50.5 | 53.3 | −2.8 |
| Health | 50 | 516 | 293 | 56.8 | 52.9 | 3.9 |
| Home Affairs | 10 | 132 | 59 | 44.7 | 46.7 | −2.0 |
| Industry, Science, Energy and Resources | 27 | 175 | 92 | 52.6 | 51.5 | 1.1 |
| Infrastructure, Transport, Regional Development and Communications | 96 | 408 | 169 | 41.4 | 40.3 | 1.1 |
| Prime Minister and Cabinet | 13 | 116 | 59 | 50.9 | 47.6 | 3.3 |
| Social Services (including Services Australia) | 6 | 36 | 25 | 69.4 | 62.0 | 7.4 |
| Treasury | 23 | 120 | 55 | 45.8 | 41.8 | 4.0 |
| Total | 342 | 2315 | 1149 | 49.6 | 48.5 | 1.1 |
Split shown given the two department structure within the Defence portfolio. Women held 49.3 per cent of positions in the Defence portfolio on 30 June 2021 (71 of 144 positions).
New appointments
New appointments are those appointments made over the 2020–21 financial year that were not re-appointments of the same person to the same position.
Of the 469 new appointments made in 2020–21, 52.2 per cent of appointees were women. This is an increase since the last annual report when women comprised 50.5 per cent of new appointees.
Table 3 shows in 2020–21, in nine of 13 portfolios, women represented 50 per cent or more of new appointments.
| Portfolio | Number of new appointments | Number of women appointed | Percentage of new appointees |
|---|---|---|---|
| Agriculture, Water and the Environment | 51 | 22 | 43.1 |
| Attorney-General’s | 37 | 22 | 59.5 |
| Defence (Department of Defence)◊ | 17 | 9 | 52.9 |
| Defence (Department of Veterans’ Affairs)◊ | 11 | 7 | 63.6 |
| Education, Skills and Employment | 56 | 27 | 48.2 |
| Finance | 3 | 3 | 100.0 |
| Foreign Affairs and Trade | 24 | 12 | 50.0 |
| Health | 63 | 36 | 57.1 |
| Home Affairs | 60 | 32 | 53.3 |
| Industry, Science, Energy and Resources | 35 | 16 | 45.7 |
| Infrastructure, Transport, Regional Development and Communications | 73 | 34 | 46.6 |
| Prime Minister and Cabinet | 15 | 11 | 73.3 |
| Social Services (including Services Australia) | 8 | 6 | 75.0 |
| Treasury | 16 | 8 | 50.0 |
| Total | 469 | 245 | 52.2 |
◊ Split shown given the two department structure within the Defence portfolio. Women made up 57.1 per cent of new appointments to the Defence portfolio on 30 June 2021 (16 of 28 appointments).
Chair and Deputy Chair roles
As the most senior board members, the Chair and Deputy Chair positions are crucial to the functioning of every board.
At 30 June 2021, women held 39.1 per cent of Chair and Deputy Chair positions across all Government boards. This result is 2.2 percentage points higher than the 30 June 2020 result, when women held 36.9 per cent of Chair and Deputy Chair positions.
Figure 2 details the portfolio results for the gender balance of Chair and Deputy Chair positions on 30 June 2021. This data excludes Chief Executive Officer, Executive Director and Managing Director positions.
External nominations
An external nomination is one which is made by a person or organisation who is not the Minister responsible for approving the appointment, or a member of their department. This may include, for example, a state or territory government or non-government body, and extends to appointment processes where it is either legislated or accepted practice for nominations to be provided to the Minister.
While all nominations are reported, not all nominations made by external bodies resulted in the appointment of the nominee. For example, multiple nominations may be received for the same vacancy.
Of the 64 external nominations received for Government board appointments in 2020–21, 50.0 per cent of nominations were for women (see Table 4). This is an increase of 0.8 percentage points from the 2019–20 result, when women accounted for 49.2 per cent of external nominations.
Figure 2: Gender balance of Chair and Deputy Chair positions as at 30 June 2021, by portfolio
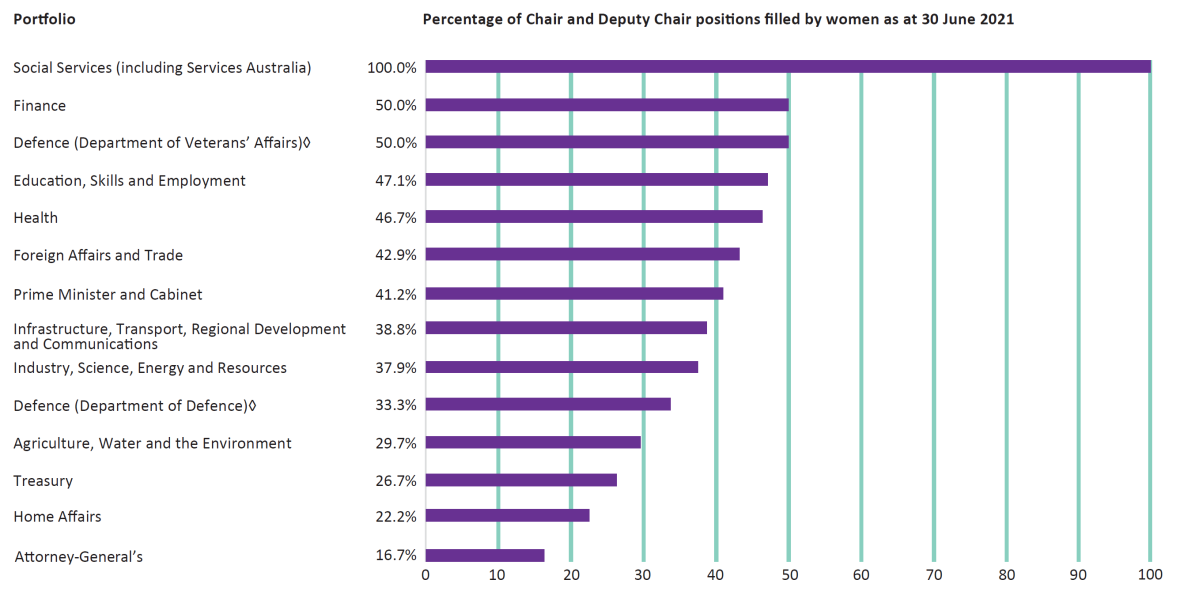
◊ Split shown given the two department structure within the Defence portfolio. Women held 40.0 per cent of Chair and Deputy Chair positions in the Defence portfolio on 30 June 2021.
| Nominating organisation | Number of nominations given | Number of women nominated | Percentage of nominees who were women |
|---|---|---|---|
| Australian Council of Trade Unions | 13 | 8 | 61.5 |
| New South Wales Government | 7 | 4 | 57.1 |
| Queensland Government | 6 | 2 | 33.3 |
| Western Australian Government | 4 | 1 | 25.0 |
| Australian Chamber of Commerce and Industry | 3 | 1 | 33.3 |
| Commonwealth Scientific and Industrial Research Organisation | 2 | 0 | 0 |
| Department of Environment, Parks and Water Security (Northern Territory) | 2 | 1 | 50.0 |
| Department of Environment and Water (South Australia) |
2 | 1 | 50.0 |
| Nomination panel for Australian Broadcasting Corporation and Special Broadcasting Service Board Appointments | 2 | 0 | 0 |
| Red Meat Advisory Council | 2 | 1 | 50.0 |
| South Australian Government | 2 | 1 | 50.0 |
| Australian Capital Territory Government | 1 | 1 | 100.0 |
| Australian Conservation Foundation | 1 | 0 | 0 |
| Australian Industry Group | 1 | 0 | 0 |
| Australian Mines and Metals Association | 1 | 1 | 100.0 |
| Associated Protestant Churches Chaplaincy Board |
1 | 0 | 0 |
| Communications, Electrical and Plumbing Union, the Australian Manufacturing Workers’ Union, Professionals Australia and the Mine Managers Association of Australia | 1 | 1 | 100.0 |
| Construction, Forestry, Maritime, Mining and Energy Union | 1 | 1 | 100.0 |
| Independent Schools Council of Australia | 1 | 1 | 100.0 |
| Maritime Industry Australia Limited | 1 | 1 | 100.0 |
| Maritime Union of Australia | 1 | 1 | 100.0 |
| National Catholic Education Commission | 1 | 1 | 100.0 |
| National Farmers Federation | 1 | 1 | 100.0 |
| New South Wales Minerals Council and the Tasmanian Minerals and Energy Council | 1 | 1 | 100.0 |
| New Zealand Government | 1 | 0 | 0 |
| Northern Territory Government | 1 | 0 | 0 |
| Queensland Resources Council | 1 | 0 | 0 |
| Safety Rehabilitation and Compensation Licensees Association and the John Holland Group |
1 | 1 | 100.0 |
| Tasmania Government | 1 | 1 | 100.0 |
| Victorian Minister for Education | 1 | 0 | 0 |
| Total | 64 | 32 | 50 |