
Surveys and questionnaires are indispensable tools for research. At their best, they are a quick, efficient way to gather feedback and opinions from a study population, and they can be an enormously valuable tool for re-designing government processes to better serve people. However, people are now bombarded with market research surveys in their everyday life, like customer satisfaction surveys in emails and popup surveys on websites. Surveys are now everywhere, and people are increasingly annoyed by them: the Pew Research Centre has found that response rates for their public opinion surveys fell dramatically from 36% in 1997 to just 9% in 2012. This decline poses a problem for researchers and policymakers, as non‑response not only decreases the amount of data gathered, it may also bias the results.
Leveraging behavioural insights can mitigate the effects of these challenges.
| 1997 % | 2000 % | 2003 % | 2006 % | 2009 % | 2012 % | |
|---|---|---|---|---|---|---|
| Contact rate (% of households in which an adult was reached) | 90 | 77 | 79 | 73 | 72 | 62 |
| Cooperation rate (% of households contacted that yielded an interview) | 43 | 40 | 34 | 31 | 21 | 14 |
| Response rate (% of households sampled that yielded an interview) | 36 | 28 | 25 | 21 | 15 | 9 |
Notes: Rates computed according to American Association for Public Opinion Research (AAPOR) standard definitions for CON2, COOP3 and RR3. Rates are typical for surveys conducted in each year.
Source: Pew Research Centre (2012).
Keeping behavioural insights in mind throughout your survey design process can help to increase response rates and improve the quality of the data you gather, while reducing the burden on respondents. We think of this as respondent-centred survey design—it’s crucial to remember that these are real people, who live incredibly busy lives, giving their time to take your survey.
In this post, we’ve gathered 5 ways you can use behavioural insights to design better surveys and maximise your response rates.
First, be deliberate about how you personalise your survey invitations. Wherever possible, personalise this invite: convey the message that this specific person’s input is important. Marketers have found that personalised invites increase response rates, as have other researchers. Here in Australia, emails recruiting participants for a study about breast cancer were 50% more likely to get a response when they included the woman’s name. If you’re targeting a specific population or group, use that in your invite. Making group affiliations salient—“we’re interested in the experience of first-generation university students at the Australian National University” versus “we’re interested in your experiences”—can also help to signal the relevance of your survey to their interests. Letting your study population know they’re part of a smaller group also avoids the diffusion of responsibility, where a potential respondent might assume that since enough other people will probably respond, they don’t have to.
Second, framing matters too. We know from Kahneman and Tversky’s prospect theory that people’s emotional response to potential losses is greater than to equally-sized potential gains. This is an insight known as loss aversion, and can be applied to research invitations. In recruiting surveyed participants for a follow-up interview, researchers compared gain framing and loss framing:
- (Gain frame) “The information you’ve already provided to us will be a lot more valuable if you complete the second interview,” or
- (Loss frame) “Unfortunately, the information you’ve already provided to us will be much less valuable unless you complete the second interview.”
The results? The loss framing saw an 87.5% response rate, compared to 77.9% in the gain framing condition.
Third, understand that people often fail to follow through on their intentions to fill out your survey, or procrastinate if the invite arrives at an inconvenient time: leverage behavioural insights to make it easy for people to participate. In one study, researchers used behavioural insights to design a survey invitation that condensed several possible steps into a single, clear action to take, within a specific time frame. It generated 53% more call-ins to participate in the study than the original letter, 7.2% compared to 4.7%. Following the initial invitation, reminders can be incredibly effective in encouraging responses from people who may have procrastinated the first time. In another study, reminders increased the response rate by over 500%, from 6.2% to 31.2%!
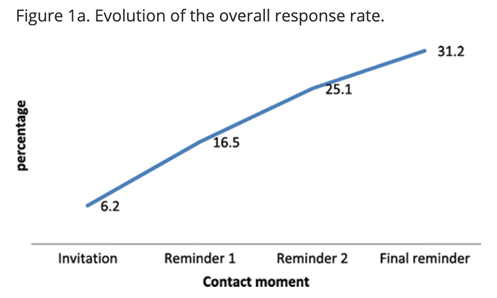
Source: Van Mol (2017, p322)
Fourth, since thoughtfully answering survey questions involves mental effort, people often seek to satisfice (a combination of “satisfy” and “suffice”). In surveys, when faced with cognitively demanding questions, Krosnik’s research suggests that respondents seek mental shortcuts and use satisficing behaviours like: choosing the first reasonable or acceptable answer, simply agreeing, just picking the same answer for a list of questions (rather than considering each individually, also termed “straightlining”), choosing “don’t know” answers when available, skipping items, or just plugging in random answers. Similarly, researchers have found that towards the end of a survey, people are more likely to skip questions, spend less time answering them and write fewer responses to open-ended questions. All of this can seriously undermine your data.
What can be done? For starters, strive to keep surveys short and sweet, for the sake of survey completion and answer quality. More generally, researchers believe the likelihood of satisficing is related to ability, motivation, and task difficulty. The thoughtfulness that goes into your survey design can influence both motivation and task difficulty: your goal should be to maximise respondent motivation, and minimise task difficulty. Explain the purpose and value of your study, ask respondents to think carefully, write questions in simple, clear language, and ask respondents to evaluate only one thing at a time where possible (comparisons are more cognitively demanding).
Finally, embrace rigorous evaluation! Behavioural scientists use rigorous evaluation and randomised controlled trials in other parts of their work, and should do the same in their surveys! When timing and funding permits, a pilot study with embedded A/B tests can help to determine exactly what invitation message, framing, incentives, phrasing, and questionnaire length get the best response rates in your particular context, which can inform the final survey instrument sent out to your study population.
In 2017, BETA partnered with the Australian Department of Social Services to test the impact of behaviourally-informed changes to their surveys on completion rates. We found that including progress updates in the form of a gradually completing pie-chart, with text encouragements, increased survey completion rates from 84.7% to 91.5%. In this case we were able to use a rigorous evaluation to find concrete evidence that the new survey design was more effective.
Emma Klugman is a statistician and education policy researcher working on her PhD at Harvard. Gabe Cederberg is an undergraduate student at Harvard studying government and economics. Emma and Gabe were interns at BETA in 2019.
References
General
- BETA 2018 ‘Easy as pie: encouraging greater survey completion’, Working Paper, Australian Department of Prime Minister and Cabinet
- Pew Research Centre 2012 ‘Assessing the representativeness of public opinion surveys’
Personalisation
- Heerwegh, D 2005, ‘Effects of personal salutations in e-mail invitations to participate in a web survey’, Public Opinion Quarterly, Vol 69, Issue 4, pp588–598
- Experian Marketing Services 2013 ‘2013 Email Market Study: How today’s email marketers are connecting, engaging and inspiring their customers’
- Sauermann, H and Roach, M 2013 ‘Increasing web survey response rates in innovation research: An experimental study of static and dynamic contact design features’ Research Policy, Vol 42, Issue 1, pp273-286
- Short, C, Rebar, A and Vandelanotte, C 2015 ‘Do personalised e-mail invitations increase the response rates of breast cancer survivors invited to participate in a web-based behaviour change intervention? A quasi-randomised 2-arm controlled trial’ BMC Med Res Methodol Vol 15, Issue 66
Framing
- Tversky, A and Kahneman, D 1992 ‘Advances in prospect theory: Cumulative representation of uncertainty’ J Risk Uncertainty Vol 5 pp297–323
- Tourangeau, R and Ye, C 2009 ‘The framing of the survey request and panel attrition’ Public Opinion Quarterly Vol 73 Issue 2 pp338–348
Procrastination and follow-through
- Johnson, A, Callahan, R, Chandler, J and Markesich, J 2017 ‘Using behavioral science to improve survey response: an experiment with the national beneficiary survey’ In Focus Brief, Mathematica Policy Research
- Van Mol, C 2017 ‘Improving web survey efficiency: the impact of an extra reminder and reminder content on web survey response’ International Journal of Social Research Methodology Vol 20 Issue 4 pp317-327
Satisficing
- Krosnick, J 1991 ‘Response strategies for coping with the cognitive demands of attitude measures in surveys’ Applied Cognitive Psychology Vol 5 Issue 3, pp213‑236
- Krosnick, J 1999 ‘Survey research’ Annual Review of Psychology Vol 50 Issue 1 pp537-567
- Krosnick, J 2000 ‘The threat of satisficing in surveys: the shortcuts respondents take in answering questions’ Survey methods newsletter Vol 20 No 1
- Galesic, M and Bosnjak, M 2009 ‘Effects of questionnaire length on participation and indicators of response quality in a web survey’ Public Opinion Quarterly Vol 73 Issue 2 pp349–360
- Hamby, T and Taylor, W 2016 ‘Survey satisficing inflates reliability and validity measures: an experimental comparison of college and amazon mechanical turk samples’ Educational and Psychological Measurement Vol 76 Issue 6 pp912-932